Basque Country from space: mapping forest height with lasers
Thanks to satellites and deep learning, it is now possible to create a comprehensive map of forest height in the Basque Country using open data.
Forest height is a key variable for understanding how forests function. It provides direct information about their structure and is closely linked to many ecological processes: biodiversity, carbon storage, timber productivity, and resilience to disturbances. Furthermore, by tracking forest height over time, we can observe how forests evolve: detect areas of deforestation, identify areas undergoing regeneration, or analyze large-scale growth patterns. But an obvious question arises:
How can we measure the height of forests throughout the Basque Country?
Obviously, we're not going to go from tree to tree with a tape measure. That's what space-based technologies are for. They're capable of systematically observing large areas of the Earth.
Measuring forests from space: the role of LiDAR
The first major data source is spaceborne LiDAR. Another article (https://medium.com/@kamel.lahssini/laser-beams-fired-from-space-to-map-forests-7b3852df6bb5) explains in greater detail how this technology works. Here, it's enough to recall the basics: LiDAR sends laser pulses toward the Earth's surface and measures the time it takes for them to return, which allows for estimating heights, including the height of vegetation.
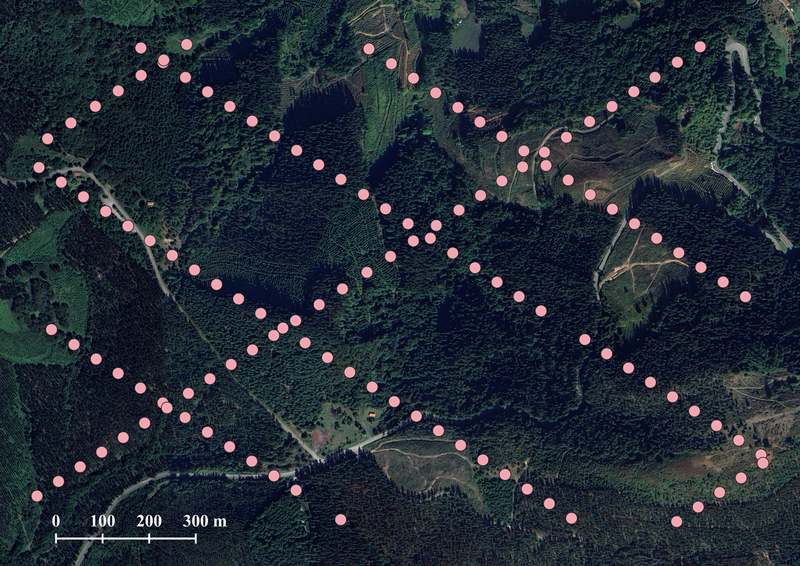
Thanks to spaceborne LiDAR, we can obtain forest height measurements across the entire Basque Country. However, these measurements are not continuous. The satellite does not measure every point in the territory, but rather discrete points that are well distributed spatially.
It's as if we had an image of forest height in the Basque Country where only a few pixels are working properly, while many others are empty or broken. But that's not what we want: we want a continuous map, a complete representation of forest height at every location. To achieve this, we need to fill in the gaps left by the LiDAR.
Additional information to fill in the blanks
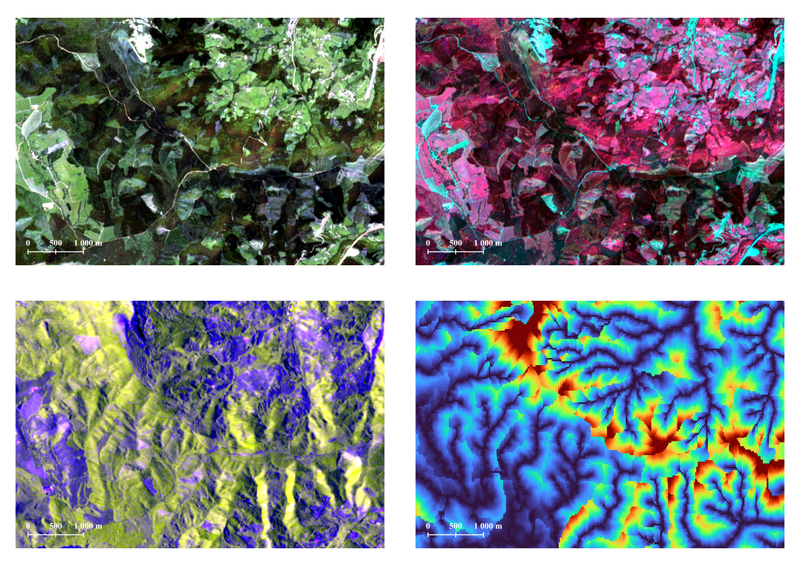
This is where other data sources come into play, all of which share a key characteristic: they are continuous, meaning we have data for every pixel in the Basque Country. Each source offers a different perspective, and all contain indirect information about forest height.
On the one hand, we use optical images, which show us what the vegetation looks like from space. These images show how the forest reflects sunlight at different wavelengths, which is related to its density, vigor, and physiological state.
On the other hand, we use radar imagery, which provides information on forest structure and spatial organization. Radar waves interact with vegetation and the ground surface, offering insights into forest roughness, spatial arrangement, and structure.
Then there is the information on the terrain, which is essential because forest height is a natural variable that is heavily influenced by the environment. A particularly powerful indicator is HAND (Height Above Nearest Drainage), which represents the height of the ground relative to the nearest drainage point. HAND combines topographic information (ground elevation) with hydrological information (how water flows across the landscape). Numerous studies have demonstrated its strong relationship with forest structure.
From raw data to forest height: deep learning
All of these data sources are complementary: each provides a different piece of the puzzle. The next step is to construct a relationship that allows us to convert all this information into forest height. And this is where deep learning models come into play.
Remember that, thanks to spaceborne LiDAR, we know the forest height at specific points. At those same points, we also have the optical, radar, and HAND data described earlier. This allows us to train a model that learns the relationship between that data and the forest height measured by the spaceborne LiDAR.
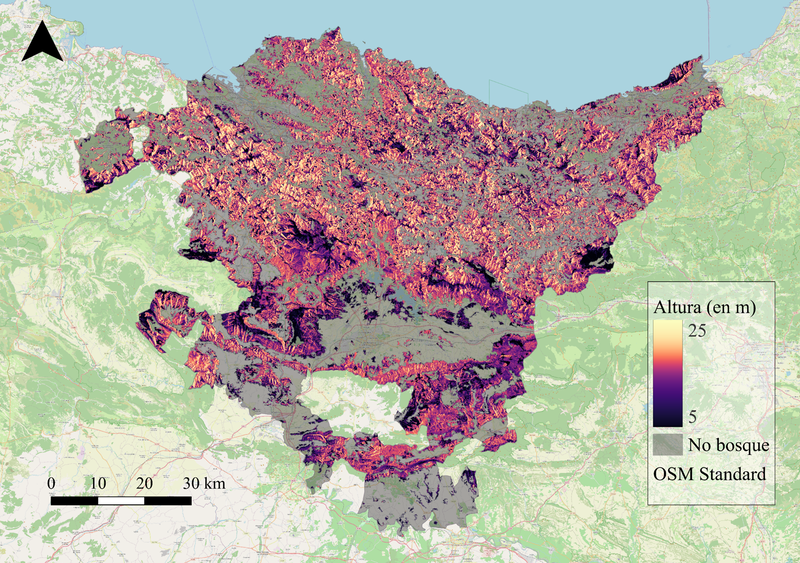
Once trained, the model can be applied to areas where there are no LiDAR measurements, filling in the gaps and thus generating a continuous map of forest height throughout the Basque Country.
Humility and caution: estimating is not the same as measuring
It is essential to remain humble here. When it comes to creating the map, we are talking about estimating, not measuring. The most accurate way to measure forest height in the Basque Country would be to survey the entire region and measure the trees directly. That is simply impossible.
That is why we have chosen to estimate, and all estimates come with errors and uncertainties. Spaceborne LiDAR itself is not perfect: it can be affected by atmospheric conditions or by complex, mountainous terrain, which is very common in the Basque Country. The other data are not ideal either, due to the physical and electronic limitations of the sensors. And, of course, deep learning models introduce their own biases and errors.
This type of map is very useful for analyzing average trends, general patterns, or large-scale phenomena. However, each individual value should always be interpreted as a value with a confidence interval, which is something that isn't always explicitly available in many deep learning methods.
So, if you're curious and look up the estimated forest height of the woods behind your house, it might not match exactly what you see with your own eyes. These types of mapping products should always be used with caution and a critical eye.
Open science to end on a positive note
To end on a positive note, it's worth noting that this forest elevation map was created using global data and tools that are completely free and open-source. So today, it's possible to conduct advanced Earth observation studies without the need for large budgets. Both the map and the code used to generate it are available in the following repository: https://doi.org/10.5281/zenodo.18361847.
Anyone with the interest, time, and necessary knowledge can replicate this type of analysis for their favorite forest or their country of origin. And that, in itself, is excellent news for science, land management, and public outreach.
Comments
No comments yet. Be the first to comment!